Statistics screen explained
The statistics screen consists of 5 different sections. Each of these sections covers a different type of data.
| Section | Description |
| Fasting & weight key indicators | Key metrics about times fasted, fasting hours & BMI + weight data. |
| Fasting & weight charts | Fasting hours & weight presented as a bar chart |
| Sleep data | Hours slept & sleep quality |
| General indicators | Mood, Energy, Activity & Sleep ratings |
| Log entry overview |
Daily log usage indicator overview. Shows the number of words entered in the daily log. Acts as an indicator for busy days. Day rating overview. Shows the day rating based on the average score from the general & sleep indicators. |
Quick start guide – Statistics screen #
Navigation options #
- Swipe to the left or right on the grey cards
- Previous period: swipe from left to right
- Next period: swipe from right to left
- Open history: double tap on the Total time fasted card
- Open month picker: double tap on the month
How to change the selected period
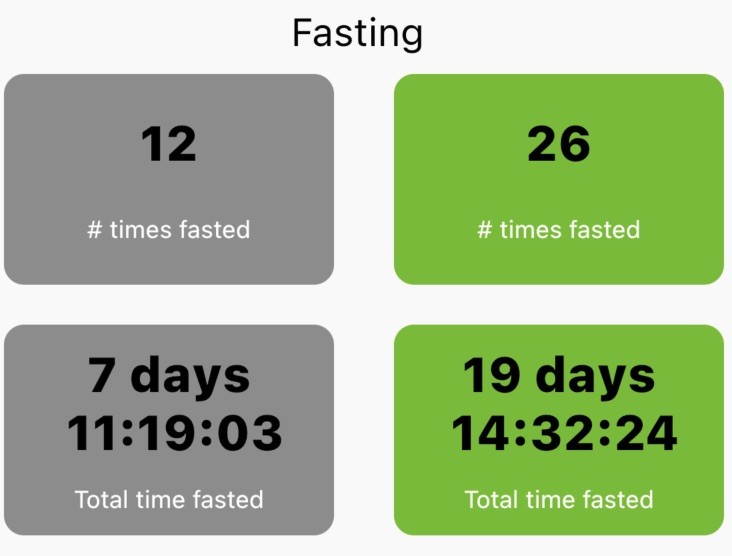
The cards on the left contain data from a previous month.
Use the arrows or swipe left/right to go back and forward in time so you can compare past data with the current month.

1. Fasting & Weight key indicators #
Available metrics
- times fasted
- total time fasted
Data blocks explained
- times fasted
Total logged fasting sessions in the selected period. - Total time fasted
Total amount of time spent fasting in the selected period - Average weight
Based on the data entries made on the BMI screen. - Average BMI
Based on the data entries made on the BMI screen.

2. Fasting / weight charts #
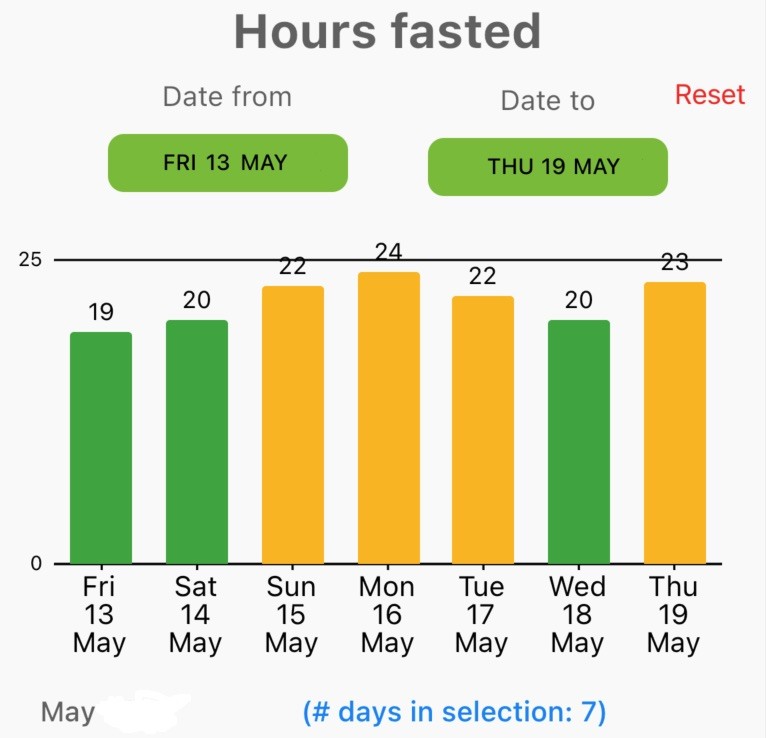
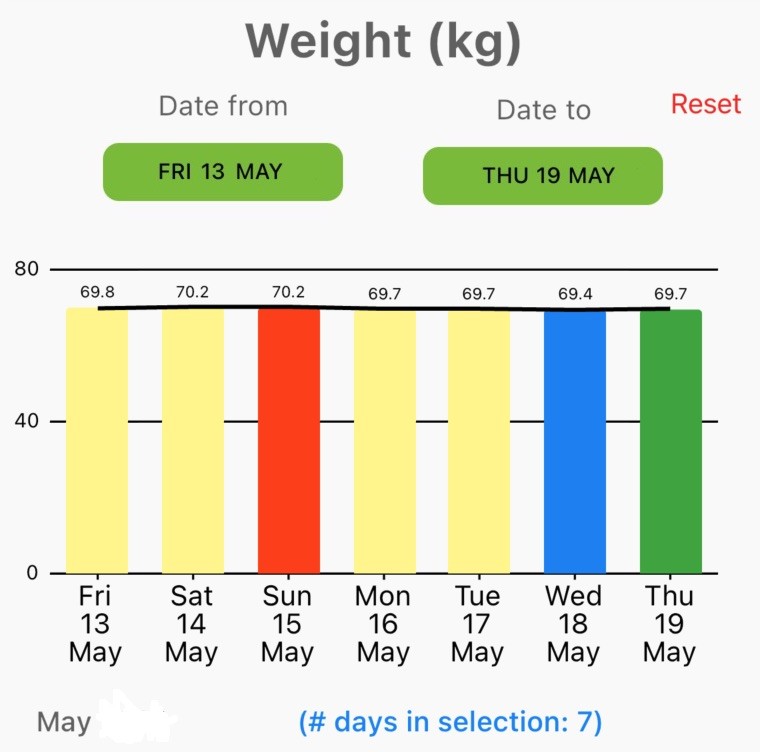
There are 2 charts available:
1. the total time fasted (in hours) for a given time period
2. your weight for a given time period
Both charts are viewable in 7, 14, 21, days or a month view.
You can change the interval by tapping on the blue ‘#days in selection’ text
Depending on the screen size of your device the charts can become unreadable in portrait mode. If this happens, you can rotate you device to landscape mode.


3. Fasting / weight charts #
There are 2 charts available:
1. the total time slept (in hours) for a given time period
2. the sleep quality based on your own rating
Both charts are viewable in 7, 14, 21, days or a month view.
You can change the interval by tapping on the blue ‘#days in selection’ text
Depending on the screen size of your device the charts can become unreadable in portrait mode. If this happens, you can rotate you device to landscape mode.
4. General indicators #
The chart relates to the daily log.
You can use the daily log to rate the day with 3 indicators:
1. General mood
2. Energy level
3. Activity level
The minimum rating is 0 and the maximum rating is 5.
The chart let you easily spot the lowest and highest ranking days.
Tip: by tapping on the Mood/Activity/Energy or Total legend you can enable or disable these values in the chart.
This chart is viewable in 7, 14, 21, days or a month view.
You can change the interval by tapping on the blue ‘#days in selection’ text
Depending on the screen size of your device the charts can become unreadable in portrait mode. If this happens, you can rotate you device to landscape mode.
5. Log entry overview #
The data is presented in a calendar view.
1. The number indicates the number of words in the log.
2. The color ranges from:
Red – no entry
Orange – small entry of text
Green – large entry of text
To open the corresponding log entry: double tap on the date tile. This wil also set the log entry date to that date. If you want to view, update or change any of the log settings you can switch to the log.


